Automating our Performance Testing with Azure DevOps, Apache JMeter, and AWS QuickSight


In this article, our engineering team explains how we test the performance (speed) of our application to ensure it responds quickly when our customers use its features. We’ll delve into our methods for automatically spotting issues and analysing long-term data trends to maintain a consistently high-quality user experience.


Before diving into performance testing, we prioritised understanding our users’ experience. By analysing key user journeys, we identified mission-critical API calls and their impact on user satisfaction. This understanding shaped our performance testing focus, targeting APIs and processes that directly influence the user experience.

To simulate real-world scenarios, we developed tools to stage high volumes of data within our solutions. This pre-testing preparation mirrors actual usage patterns, ensuring our performance tests are both realistic and impactful.

Our Nightly Pipeline for Confidence

Every night, our release pipeline runs a comprehensive suite of tests designed to validate the end-to-end functionality, stability, performance and usability of our platform.

  • End-to-End Tests: Using User-Experience tools such as (playwright and cypress) we automatically mimic our users actions. These types of tools are often used earlier in the development cycle, whilst we do this we also run them automatically, headless in our nightly pipeline.
  • Pricing Tests: Validating the accuracy of pricing algorithms.
  • Database Resets: Guaranteeing data integrity and a clean slate for each test (Idempotency!).
  • Data Staging: We load data into our environments automatically to ensure tests are life-like.
  • Security Tests: Perform automated penetration testing and code scanning.
  • Infrastructure Deployment: Using tools like terraform we ensure that environments are consistent and no drift has occurred.
  • Performance Testing: Stress-testing API routes and functions that support critical-paths on our user experience.

This meticulous pipeline ensures an idempotent environment where results remain consistent regardless of previous states.

The Performance Testing Process

Our performance testing stage centres on measuring the efficiency of critical API routes, those that perform significant functions or manage heavy traffic. By Using Apache JMeter we:

    • Simulate concurrent user loads to stress-test APIs.
    • Monitor response times and system behaviour under varying loads.
    • Automatically trigger alerts when performance metrics exceed predefined thresholds.


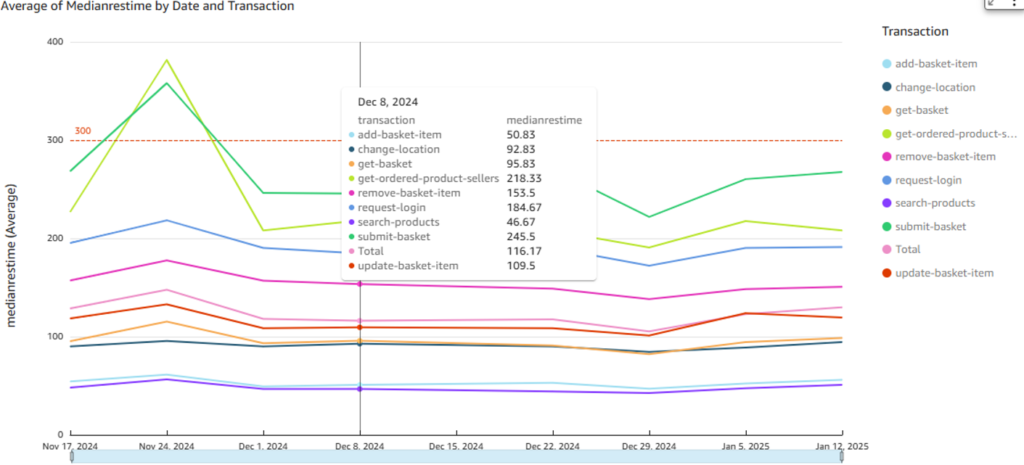
All performance data is stored in Amazon S3 using HIVE architecture, AWS Glue, and Athena. This setup allows us to visualise long-term trends in AWS QuickSight. These insights are then reviewed regularly during developer discussions, enabling us to stay proactive.


The Importance of Long-Term Trends

The Importance of Long-Term Trends

While immediate alerts for our performance deviations are invaluable, we find they only tell part of the story. Long-term trends highlight gradual changes, for instance, an API slowly becoming less efficient over time. Spotting these patterns early allows us to address potential issues before they escalate, reducing costly interventions down the line.

  1.  

The Value of On-Site Customer Interaction

Spending time with customers, particularly face-to-face, remains an irreplaceable practice, especially in the post-Covid era. It fosters deeper connections and provides clarity on user behaviours that virtual interactions may not fully capture. Many of our most successful innovations have stemmed from on-site visits. Discussing challenges and witnessing how users interact with software in real environments can spark creative, customer-centric solutions that advance the platform.

Looking Ahead

Our performance testing strategy is evolving. Here’s what’s next on our roadmap:

  1. 1. Automated Analysis of Trends: Reducing manual effort by using machine learning to identify anomalies and patterns in performance data.
  2. 2. Dynamic Test Updates: Automating the generation of performance tests based on API definitions. This ensures new routes and endpoints are automatically included in our testing regimen, saving time and effort.

Using JMeter in our Pipelines (Technical)

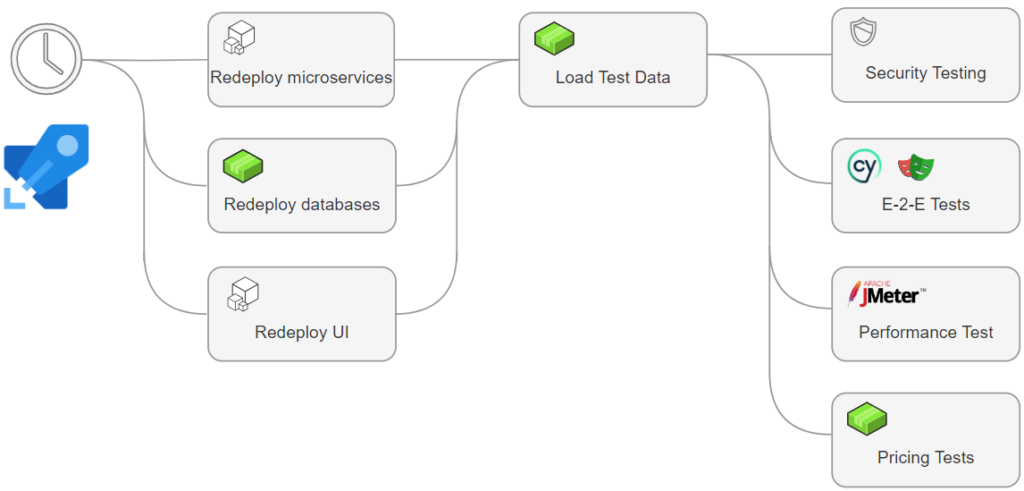
The following process outlines the steps executed within an Azure DevOps release pipeline that our team utilises to ensure effective performance testing and evaluation:

  1. Ramp-Up Period and User Credentials: We establish a ramp-up period of 40 seconds to simulate a realistic transition from normal to peak usage hours. For each thread executed during the test, we utilise different user credentials to better mimic real-world scenarios.
  1. Dynamic Variable Population: Before the actual performance test begins, we employ a “Once Only Controller” that populates variables with dynamic information needed for the test, such as authentication tokens and product identifiers.
  2. Performance Testing: Once all variables are filled, the performance test proceeds to evaluate critical endpoints under heavy load. This includes testing essential functions such as user login, product searching, and the order creation journey. We ensure that every relevant aspect of the user journey is tested, including:
  • Adding products to the basket
  • Updating quantities
  • Removing items
  • Submitting multiple baskets to generate orders

  1.  
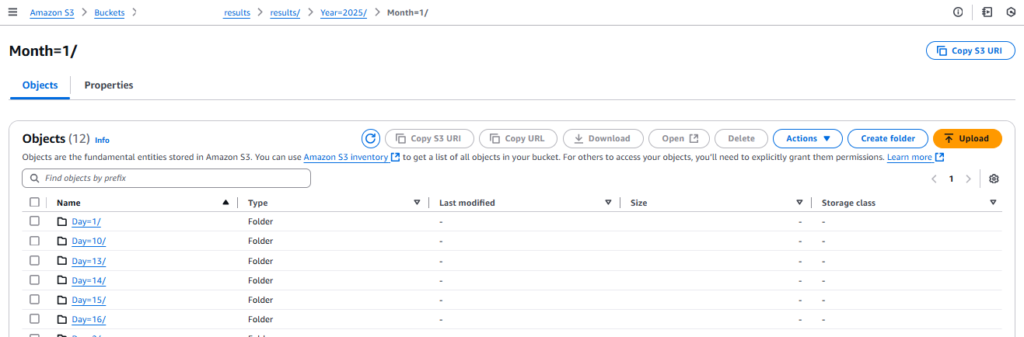
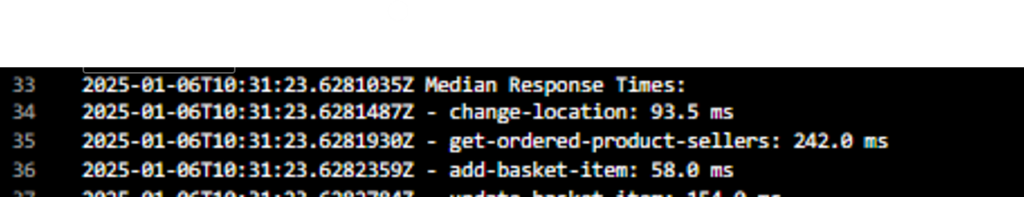
  2. Results Generation and Threshold Evaluation: Upon completion of the test, a JSON file containing statistics for each endpoint is generated and exported to a designated directory that adheres to the HIVE architecture (results/Year={year}/Month={month}/Day={day}). The performance results are then assessed against a predefined list of thresholds established through careful analysis of each endpoint’s median performance.
  3.  
  4.  
  5. Pipeline Evaluation: If any endpoint fails to meet the performance criteria, it triggers a failure in the process. This allows the team to promptly investigate the issue and conduct a briefing on the situation before proceeding with the next steps.

  6.  
  7. Results Upload and Data Analysis: The performance test outcomes are uploaded to an AWS S3 bucket. Our team evaluates these results using AWS QuickSight, which retrieves data through queries executed by AWS Athena on AWS Glue catalogues. This setup allows for efficient data partitioning and filtering over time (thanks to the HIVE architecture!), enabling the generation of insightful statistical dashboards.
  8.  

Our Conclusion

By integrating performance testing into our pipelines, we’ve established a robust approach that ensures our platform consistently delivers the experience our users expect. Combining tools like Apache JMeter, AWS QuickSight, and ADO Pipelines has been transformative, enabling us to monitor, analyse, and improve performance effectively.


Mateo Nores, Sam Williams

© DLS Health 2024